In recognition of October as Breast and Liver Cancer awareness month, and in our continuing effort to help shine light on the benefit of cancer registries, we would like to present the North Carolina rates and trends (provided by the CDC) made possible by the data collected on a case-by-case basis by certified tumor registrars (CTR). The collected data (1.6 million new cancer cases in the USA in 2020, processed by 6500+ cancer registry professionals), which reflects the patient’s journey from diagnosis through treatment and lifetime follow-up, is then sent to state and national entities where it is used to determine incidence rates/trends/effective treatments/evolving research for cancer treatment and create national reports and statistics on cancer.
Certified Tumor Registrars (CTR) are, as stated by the National Cancer Registrars Association (NCRA): Cancer registrars are data information specialists that capture a complete history, diagnosis, treatment, and health status for every cancer patient in the U.S. The curated data provides essential information to researchers, healthcare providers, and public health officials to better monitor and advance cancer treatments, conduct research, and improve cancer prevention and screening programs.
North Carolina Central Cancer Registry, as part of the CDC National Program for Cancer Registries (NPCR), requires the collection of cases dating back to their reference date of 01/01/1990. NPCR and National Cancer Institute’s Surveillance, Epidemiology and End Results (NCI SEER) program CTRs collect 100% of cancers diagnosed in this country.
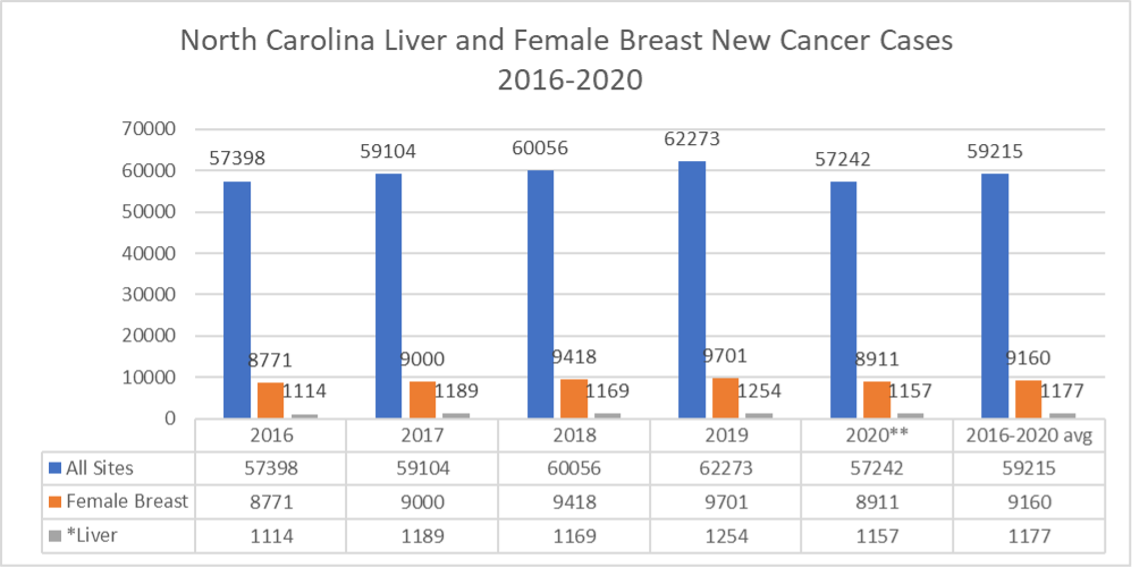
Graph description: Comparison of new Liver and Female Breast cancer cases to the total number of new cancer cases in North Carolina for the 5-year period 2016-2020. * Liver Cancer data includes Liver and Intrahepatic Bile Duct primary sites. **The COVID-19 pandemic disrupted health services, leading to delays and reductions in cancer screening, diagnosis, and reporting of data to some cancer registries. This may have contributed to the decline in new cancer cases for many sites in 2020.
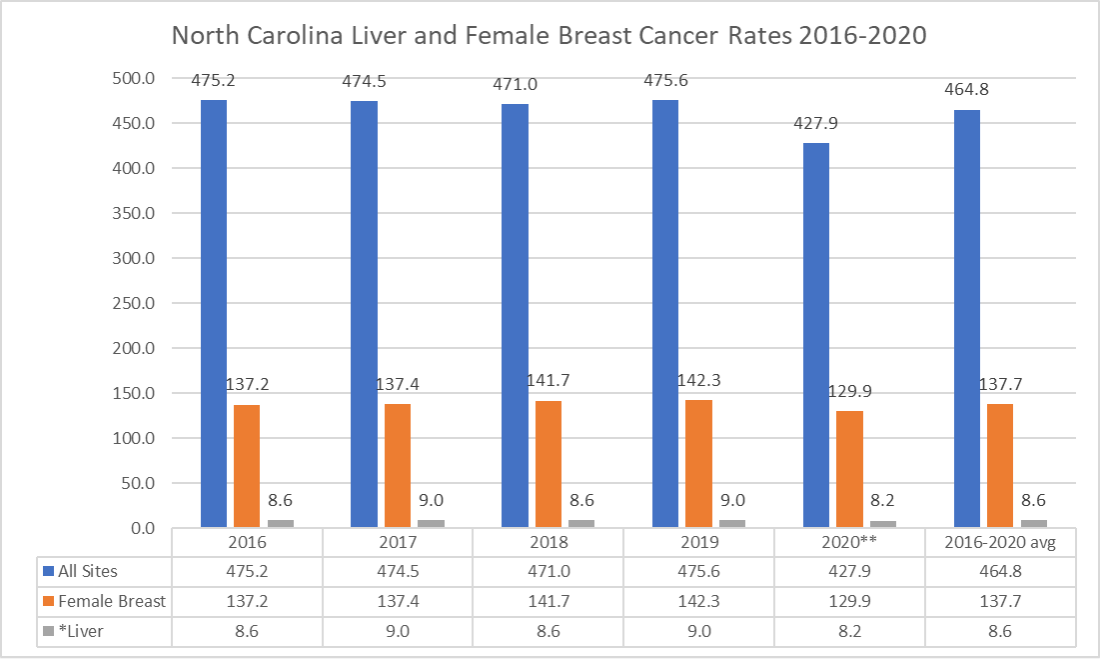
Graph description: The rates within the above graph are age-adjusted to 2000 US Standard Population and represent cases per 100,000 people. **The COVID-19 pandemic disrupted health services, leading to delays and reductions in cancer screening, diagnosis, and reporting of data to some cancer registries. This may have contributed to the decline in new cancer cases for many sites in 2020.
Graphs Data Citation: U.S. Cancer Statistics Working Group. U.S. Cancer Statistics Data Visualizations Tool, based on 2022 submission data (1999-2020): U.S. Department of Health and Human Services, Centers for Disease Control and Prevention and National Cancer Institute; https://www.cdc.gov/cancer/dataviz, released in June 2023.
Conclusion Statement: The collection of this data by CTRs and cancer registries is imperative and allows the CDC to release reports and trends used to determine how to improve screening protocols and treatment modalities with the hope of diagnosing cancers sooner and improving cancer survival rates.